
State of the self-employed sector in 2022, self-employed statistics in the UK
Posted on 21st June 2022 by Phil Ainley
In 2018 we wrote an article covering the astounding growth of the number of self-employed professionals in the UK.
The UK economy has experienced some testing challenges since the onset of the Coronavirus pandemic in 2020. Many sectors such as retail, construction, leisure and hospitality have suffered devasting financial constraints which has had an impact on the workforce.
However, the sector that has arguably been affected the most in recent years is that of the self-employed and freelance contractors.
Freelance contractors have also had to stomach significant changes to their ability to earn via the IR35 off-payroll working legislation that was introduced in April 2021. The effects of which began to be felt by private sector contractors in early 2019 when anxieties surrounding IR35 started to mount.
As such, we look at how these challenges have potentially changed the self-employed sector. Has it grown? Has the sector contracted? Has there been a change in which professions are the most popular to be self-employed?
What did the self-employed sector look like prior to Covid-19 and IR35?
According to figures from the Office for National Statistics (ONS), as recently as Q4 in 2019 (October to December), there were 5,025,000 self-employed people in the UK. That figure represented a 41% increase from the 3.56million self-employed in Q1 in 1995.
So, just prior to the Covid-19 pandemic the self-employed sector was buoyant, with many professionals leaving their stable PAYE jobs to pursue their passions, make their own decisions, and take charge of their own destinies.
But just how have recent events affected the self-employed sector as a whole?
The self-employed sector in the post Covid-19 and post private sector IR35 era
It has been well documented in recent years how unfair the off-payroll working legislation is and a recent survey we undertook highlighted the affects it has had on self-employed contractors, the dip in the number of work opportunities and their income. But which sectors do the statistics show as being the worst affected?
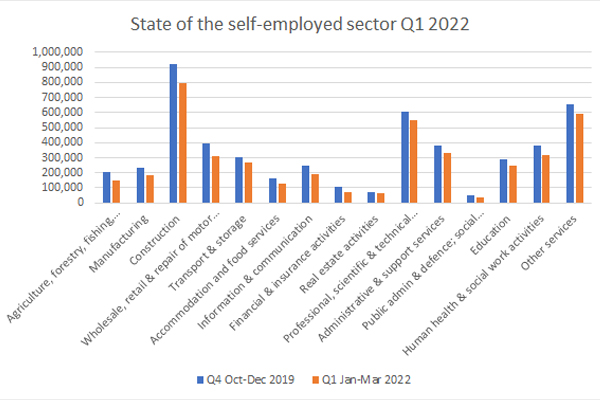
According to figures published by ons.gov.uk, there has been a significant drop in the number of self-employed professionals since Q1 2019, with every sector experiencing an exodus of experts.
There are many reasons for the drop that are nothing to do with Covid-19 and IR35, for some people it can be retirement, for others it could be a new opportunity that is simply too good to turn down.
However, the scale of the drop, as shown in the table below, in UK self-employed professionals suggests otherwise.
| Sector | Q4 Oct-Dec 2019 | Q1 Jan-Mar 2022 | % drop |
| Total self-employed | 5,025,000 | 4,232,000 | -15.79 |
| Agriculture, forestry, fishing, mining, energy & water | 204,000 | 149,000 | -27.00 |
| Manufacturing | 234,000 | 185,000 | -20.94 |
| Construction | 921,000 | 799,000 | -13.25 |
| Wholesale, retail & repair of motor vehicles | 396,000 | 308,000 | -22.23 |
| Transport & storage | 306,000 | 268,000 | -12.42 |
| Accommodation and food services | 162,000 | 128,000 | -21.00 |
| Information & communication | 249,000 | 190,000 | -23.70 |
| Financial & insurance activities | 104,000 | 71,000 | -31.73 |
| Real estate activities | 74,000 | 62,000 | -16.22 |
| Professional, scientific & technical activities | 609,000 | 551,000 | -9.53 |
| Administrative & support services | 384,000 | 329,000 | -14.33 |
| Public admin & defence; social security | 52,000 | 36,000 | -30.77 |
| Education | 291,000 | 246,000 | -15.47 |
| Human health & social work activities | 381,000 | 316,000 | -17.07 |
| Other services | 653,000 | 589,000 | -9.80 |
Table 1
While the figures in Table 1 may seem alarming, some sectors have rallied in the past 12 months and experienced some growth, whilst other sectors have seen their contraction slow down, as follows in Table 2:
| Sector | Q1 Jan-Mar 2021 | Q1 Jan-Mar 2022 | % drop / increase |
| Total self-employed | 4,281,000 | 4,232,000 | -1.15 |
| Agriculture, forestry, fishing, mining, energy & water | 162,000 | 149,000 | -8.03 |
| Manufacturing | 192,000 | 185,000 | -3.65 |
| Construction | 769,000 | 799,000 | +3.90 |
| Wholesale, retail & repair of motor vehicles | 369,000 | 308,000 | -16.54 |
| Transport & storage | 245,000 | 268,000 | +9.38 |
| Accommodation and food services | 133,000 | 128,000 | -3.76 |
| Information & communication | 195,000 | 190,000 | -2.57 |
| Financial & insurance activities | 111,000 | 71,000 | -36.04 |
| Real estate activities | 67,000 | 62,000 | -7.47 |
| Professional, scientific & technical activities | 613,000 | 551,000 | -10.12 |
| Administrative & support services | 281,000 | 329,000 | +17.08 |
| Public admin & defence; social security | 41,000 | 36,000 | +12.20 |
| Education | 250,000 | 2346,000 | +1.60 |
| Human health & social work activities | 287,000 | 316,000 | +10.10 |
| Other services | 561,000 | 589,000 | +4.99 |
Table 2
Sources:


Sed ut perspiciatis unde omnis iste natus error sit voluptatem accusantium doloremque laudantiumIR35 Hub
Sed ut perspiciatis unde omnis iste natus error sit voluptatem accusantium doloremque laudantiumKnowledge Centre
Sed ut perspiciatis unde omnis iste natus error sit voluptatem accusantium doloremque laudantium